

Editor’s Note:
Many may not realize that Tennessee is one of the most unhealthy and overweight states in the nation. I didn’t realize how poor our state ranked until I started doing research for my Fresh Food Affordability (FFA) Act.
I filed legislation to help lower the cost of living for families in the Volunteer State. House Bill 2086, the Fresh Food Affordability Act, would eliminate the state sales tax on fresh fruits and vegetables in Tennessee — encouraging Tennesseans to eat healthier and save money at the grocery store. I think this is the best bill introduced this year. Here’s why.
Nobel Prize-winning economist Milton Friedman put it simply: “Taxes are incentives. If we tax something, we get less of it.” The reverse is equally true — if we stop taxing something, we get more of it. That’s exactly the logic behind the FFA Act. Remove the tax on fresh produce, and Tennesseans will buy more of it.
By cutting taxes, we put more of citizens’ hard-earned money back in their pockets — and over time, better food choices lead to better health outcomes. Tennessee taxpayers shell out billions because of poor health. The TennCare budget continues to balloon with no end in sight. The FFA Act won’t fix that overnight, but it’s a step in the right direction — and it does it by trusting families with their own money, not by expanding government.
TennCare seeks $975M in additional funding tied to medical costs, price of new obesity drugs
_____________________________________________________________________________
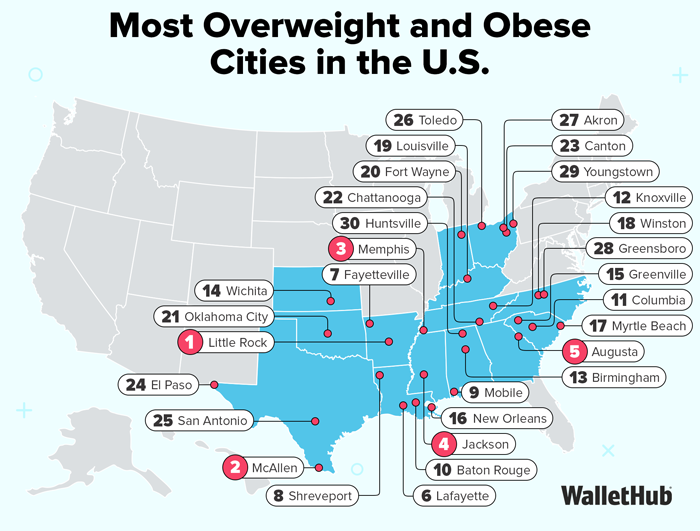
Most Overweight and Obese Cities in the U.S. (2026)
Adam McCann, WalletHub Financial WriterMar 16, 2026
Americans are some of the most overweight people in the world, not just stereotypically but statistically too. In fact, nearly 42% of U.S. adults are obese, and it’s costing us. Unfortunately, the extra pounds have inflated the costs of obesity-related medical treatment to approximately $190.2 billion a year and annual productivity losses due to work absenteeism to around $4.3 billion.

Certain places are more responsible than others for tipping the scale in favor of poor health, though. To identify them, WalletHub compared 100 of the most populated U.S. metro areas across 19 key indicators of weight-related problems. Our data set ranges from the share of physically inactive adults to projected obesity rates by 2050 to healthy-food access.

“Obesity is becoming more and more prevalent in the U.S., and it’s costing us big time. In the most overweight and obese cities, residents often lack easy access to healthy food and recreation opportunities, so investing in those areas should help improve people’s diets and exercise regimens, and reduce the financial burden overall.”
~ CHIP LUPO, WALLETHUB ANALYST
Rep. Mike Sparks Rutherford Pushes Grocery TAX CUT for This Year: ‘Tennessee is Overweight!’
| Overall Rank | Metro Area | Total Score | Obesity & Overweight Rank | Health Consequences Rank | Food & Fitness Rank |
|---|---|---|---|---|---|
| 1 | Little Rock, AR | 83.96 | 3 | 5 | 3 |
| 2 | McAllen, TX | 83.22 | 5 | 4 | 4 |
| 3 | Memphis, TN | 83.09 | 17 | 1 | 2 |
| 4 | Jackson, MS | 82.49 | 1 | 14 | 17 |
| 5 | Augusta, GA | 81.78 | 7 | 9 | 8 |
| 6 | Lafayette, LA | 81.66 | 8 | 6 | 15 |
| 7 | Fayetteville, AR | 81.62 | 2 | 16 | 27 |
| 8 | Shreveport, LA | 81.42 | 11 | 7 | 12 |
| 9 | Mobile, AL | 81.38 | 15 | 2 | 13 |
| 10 | Baton Rouge, LA | 80.20 | 10 | 3 | 29 |
| 11 | Columbia, SC | 79.57 | 13 | 22 | 5 |
| 12 | Knoxville, TN | 79.51 | 26 | 10 | 11 |
| 13 | Birmingham, AL | 79.46 | 23 | 8 | 14 |
| 14 | Wichita, KS | 79.24 | 24 | 18 | 6 |
| 15 | Greenville, SC | 78.63 | 12 | 38 | 9 |
| 16 | New Orleans, LA | 78.26 | 9 | 11 | 38 |
| 17 | Myrtle Beach, SC | 78.23 | 16 | 23 | 26 |
| 18 | Winston, NC | 77.83 | 56 | 13 | 1 |
| 19 | Louisville, KY | 77.64 | 6 | 17 | 57 |
| 20 | Fort Wayne, IN | 77.64 | 40 | 21 | 7 |
| 21 | Oklahoma City, OK | 77.62 | 18 | 26 | 20 |
| 22 | Chattanooga, TN | 77.34 | 38 | 24 | 10 |
| 23 | Canton, OH | 77.09 | 45 | 15 | 23 |
| 24 | El Paso, TX | 76.75 | 4 | 77 | 30 |
| 25 | San Antonio, TX | 76.54 | 19 | 12 | 51 |
| 26 | Toledo, OH | 76.13 | 27 | 40 | 22 |
| 27 | Akron, OH | 75.90 | 25 | 45 | 36 |
| 28 | Greensboro, NC | 75.88 | 47 | 20 | 21 |
| 29 | Youngstown, OH | 75.72 | 14 | 81 | 16 |
| 30 | Huntsville, AL | 75.43 | 33 | 95 | 19 |
| 31 | Charleston, SC | 75.31 | 31 | 60 | 31 |
| 32 | Lexington-Fayette, KY | 75.22 | 28 | 46 | 33 |
| 33 | Tulsa, OK | 75.17 | 32 | 52 | 25 |
| 34 | Albuquerque, NM | 74.98 | 21 | 33 | 50 |
| 35 | Dallas, TX | 74.94 | 20 | 51 | 37 |
| 36 | Nashville, TN | 74.83 | 41 | 44 | 28 |
| 37 | Indianapolis, IN | 74.77 | 46 | 25 | 34 |
| 38 | Riverside, CA | 74.76 | 55 | 30 | 18 |
| 39 | Dayton, OH | 74.70 | 48 | 32 | 32 |
| 40 | Detroit, MI | 74.49 | 68 | 19 | 24 |
| 41 | Des Moines, IA | 73.95 | 30 | 70 | 43 |
| 42 | Houston, TX | 73.82 | 22 | 27 | 73 |
| 43 | Charlotte, NC | 73.63 | 42 | 34 | 46 |
| 44 | Kansas City, MO | 72.90 | 37 | 61 | 47 |
| 45 | Columbus, OH | 72.71 | 44 | 48 | 49 |
| 46 | Richmond, VA | 72.70 | 69 | 36 | 40 |
| 47 | Cleveland, OH | 72.62 | 43 | 47 | 52 |
| 48 | Virginia Beach, VA | 72.30 | 54 | 29 | 58 |
| 49 | Providence, RI | 72.16 | 50 | 58 | 60 |
| 50 | Omaha, NE | 71.91 | 34 | 53 | 69 |
| 51 | Orlando, FL | 71.72 | 52 | 28 | 65 |
| 52 | Grand Rapids, MI | 71.71 | 51 | 69 | 53 |
| 53 | Cincinnati, OH | 71.55 | 36 | 39 | 81 |
| 54 | Scranton, PA | 71.40 | 73 | 54 | 41 |
| 55 | Phoenix, AZ | 71.10 | 58 | 63 | 44 |
| 56 | Atlanta, GA | 70.99 | 29 | 56 | 86 |
| 57 | Asheville, NC | 70.86 | 77 | 59 | 48 |
| 58 | Baltimore, MD | 70.73 | 57 | 41 | 68 |
| 59 | St. Louis, MO | 70.61 | 35 | 75 | 75 |
| 60 | Austin, TX | 70.43 | 39 | 57 | 82 |
| 61 | Jacksonville, FL | 70.29 | 61 | 55 | 62 |
| 62 | Tampa, FL | 70.27 | 71 | 31 | 70 |
| 63 | Hartford, CT | 70.18 | 70 | 78 | 55 |
| 64 | Durham, NC | 69.99 | 66 | 82 | 39 |
| 65 | Las Vegas, NV | 69.82 | 60 | 37 | 85 |
| 66 | Raleigh, NC | 69.78 | 63 | 50 | 71 |
| 67 | Anchorage, AK | 69.76 | 64 | 62 | 63 |
| 68 | New Haven, CT | 69.51 | 72 | 80 | 66 |
| 69 | Milwaukee, WI | 69.50 | 65 | 49 | 74 |
| 70 | Philadelphia, PA | 69.29 | 53 | 35 | 91 |
| 71 | Spokane, WA | 68.97 | 75 | 73 | 59 |
| 72 | Allentown, PA | 68.54 | 79 | 85 | 56 |
| 73 | Portland, ME | 68.43 | 67 | 90 | 77 |
| 74 | Reno, NV | 68.13 | 59 | 93 | 64 |
| 75 | Manchester, NH | 68.01 | 88 | 65 | 54 |
| 76 | Los Angeles, CA | 67.64 | 80 | 43 | 83 |
| 77 | Tucson, AZ | 67.40 | 78 | 71 | 80 |
| 78 | Worcester, MA | 66.95 | 93 | 64 | 45 |
| 79 | Pittsburgh, PA | 66.72 | 62 | 88 | 88 |
| 80 | Chicago, IL | 66.64 | 49 | 83 | 95 |
| 81 | Bridgeport, CT | 66.40 | 81 | 98 | 72 |
| 82 | Ogden, UT | 66.21 | 95 | 74 | 42 |
| 83 | Springfield, MA | 65.29 | 91 | 86 | 61 |
| 84 | San Diego, CA | 65.27 | 86 | 72 | 90 |
| 85 | Washington, DC | 64.88 | 74 | 67 | 96 |
| 86 | Boise, ID | 64.79 | 92 | 42 | 84 |
| 87 | Provo, UT | 64.67 | 98 | 89 | 35 |
| 88 | Miami, FL | 64.30 | 83 | 100 | 79 |
| 89 | New York, NY | 64.22 | 82 | 76 | 99 |
| 90 | Sacramento, CA | 63.66 | 76 | 99 | 92 |
| 91 | Portland, OR | 63.52 | 84 | 66 | 97 |
| 92 | Salt Lake City, UT | 63.37 | 97 | 84 | 76 |
| 93 | Minneapolis, MN | 63.29 | 85 | 79 | 94 |
| 94 | San Francisco, CA | 62.92 | 87 | 87 | 98 |
| 95 | Boston, MA | 61.81 | 94 | 92 | 87 |
| 96 | San Jose, CA | 61.80 | 90 | 91 | 93 |
| 97 | Colorado Springs, CO | 61.56 | 100 | 68 | 67 |
| 98 | Seattle, WA | 60.80 | 89 | 94 | 89 |
| 99 | Denver, CO | 59.19 | 99 | 96 | 78 |
| 100 | Honolulu, HI | 58.81 | 96 | 97 | 100 |

Note: With the exception of “Total Score,” all of the columns in the table above depict the relative rank of that metro area, where a rank of 1 represents the worst conditions for that metric category.
% of Obese Adults
Highest
-
1. McAllen, TX
-
2. Fort Wayne, IN
-
3. Shreveport, LA
-
4. Fayetteville, AR
-
5. Youngstown, OH

Lowest
-
96. Miami, FL
-
97. Tucson, AZ
-
98. San Diego, CA
-
99. Bridgeport, CT
-
100. Asheville, NC
Best City vs. Worst City: 2x Difference
McAllen, TX vs. Asheville, NC
% of Physically Inactive Adults
Highest
- 1. McAllen, TX
- 2. Jackson, MS
- 3. Lexington-Fayette, KY
- 4. Tulsa, OK
- 5. Miami, FL

Lowest
- 96. Portland, ME
- 97. Denver, CO
- 98. Seattle, WA
- 99. Raleigh, NC
- 100. Provo, UT
Show More
In-Depth Look at the Most Overweight Cities
Little Rock, AR
Little Rock, AR, is the most overweight city, and it has the second-highest rate of obesity among children ages 10-17, at nearly 23%, with nearly another 18% of young people being overweight but not obese. The city also has very high rates of teenage obesity.
Little Rock’s obesity problem shows in the health conditions that residents have. For example, the city has the fourth-highest percentage of adults with high blood pressure and also the fifth-highest heart-disease rate.
Factors that contribute to the high rates of obesity in Little Rock include lowest numbers of health educators per capita and limited access to healthy foods. The problem will likely remain for the foreseeable future, too, as Little Rock has the second-highest projected obesity rate for 2050.
McAllen, TX
McAllen, TX, ranks as the second-most overweight city in the country, because it has the largest percentage of adults who are obese, at 45%, with an additional 31% overweight but not obese. McAllen also has the second-highest share of obese teenagers.
In addition to the general obesity statistics, McAllen residents are also very affected by diseases related to being an unhealthy weight. For example, the city has the seventh-highest share of people with diabetes and the fourth-highest heart-disease rate.
One reason why many people in McAllen are overweight is because they don’t exercise very much, as the city has the highest share of physically inactive adults. That may not be entirely their fault, considering McAllen has the second-lowest percentage of residents who live close to parks or recreational facilities.
Memphis, TN
Memphis, TN, is the third-most overweight city, with high rates of obesity for children, teenagers and adults. Around 36% of adults are obese.
Memphis also has the fourth-highest percentage of adults that had a stroke, and the third-highest rate of high blood pressure, at 40%.
Not exercising regularly is a big reason why many of Memphis’s residents are overweight and obese. The city has the 16th-highest rates of physically inactive adults, and many residents lack easy access to healthy food.
Ask the Experts
Fighting obesity requires a multi-level approach. We turned to a panel of experts for the best ways to address the problem, from the personal to policy level. Click on the experts’ profiles to read their bios and responses to the following key questions:
-
What are some tips for eating healthy without breaking the bank?
-
What are the biggest mistakes people make when trying to achieve and maintain a healthy lifestyle?
-
What are some measures that individuals can take to prevent severe health complications caused by obesity?
-
Should employers play a role in helping workers maintain a healthy lifestyle? If so, how?
-
What policies should federal and/or state governments pursue to combat obesity and lower the cost of health care?

Andrew Burnstine
Ph.D. – Associate Professor, College of Business and Management – Lynn University
READ MORE
Ph.D. – Associate Professor, College of Business and Management – Lynn University
READ MORE

Kim Doughty
MPH, PhD, CHES® – Assistant Professor and Undergraduate Program Director, Public Health, Marion Peckham Egan School of Nursing and Health Studies – Fairfield University
READ MORE
MPH, PhD, CHES® – Assistant Professor and Undergraduate Program Director, Public Health, Marion Peckham Egan School of Nursing and Health Studies – Fairfield University
READ MORE

Michael Peterson
Ed.D. – Professor and Director, Social Marketing and Health Communication Lab; HBS Internship Director, Department of Behavioral Health and Nutrition – University of Delaware
READ MORE
Ed.D. – Professor and Director, Social Marketing and Health Communication Lab; HBS Internship Director, Department of Behavioral Health and Nutrition – University of Delaware
READ MORE

Cristina Palacios
Ph.D. – Professor and Chair, Department of Dietetics and Nutrition, Robert Stempel College of Public Health & Social Work – Florida International University
READ MORE
Ph.D. – Professor and Chair, Department of Dietetics and Nutrition, Robert Stempel College of Public Health & Social Work – Florida International University
READ MORE

Stephen Ball
Professor of Physical Therapy, College of Health Sciences – University of Missouri
READ MORE
Professor of Physical Therapy, College of Health Sciences – University of Missouri
READ MORE

Trina Aguirre
Ph.D., RN – Associate Professor and SNA Advisor – University of Nebraska Medical Center, College of Nursing
READ MORE
Ph.D., RN – Associate Professor and SNA Advisor – University of Nebraska Medical Center, College of Nursing
READ MORE
More Experts
Methodology
In order to determine the fattest cities in America, WalletHub compared 100 of the most populated U.S. metro areas across three key dimensions: 1) Obesity & Overweight, 2) Health Consequences and 3) Food & Fitness.
We evaluated those dimensions using 19 relevant metrics, which are listed below with their corresponding weights. Each metric was graded on a 100-point scale, with a score of 100 representing the “fattest.” Data for metrics marked with an asterisk (*) were available only at the state level.
We then determined each metro area’s weighted average across all metrics to calculate its overall score and used the resulting scores to rank-order our sample.
Obesity & Overweight – Total Points: 60
-
Share of Overweight Adults: Full Weight (~13.33 Points)
-
Share of Obese Adults: Full Weight (~13.33 Points)
-
Share of Overweight Teenagers*: Half Weight (~6.67 Points)
Note: “Teenagers” includes 9th through 12th grade students.
-
Share of Obese Teenagers*: Half Weight (~6.67 Points)
Note: “Teenagers” includes 9th through 12th grade students.
-
Share of Overweight Children*: Half Weight (~6.67 Points)
Note: “Children” includes persons ages 10 to 17.
-
Share of Obese Children*: Half Weight (~6.67 Points)
Note: “Children” includes persons ages 10 to 17.
-
Projected Obesity Rates by 2050*: Half Weight (~6.67 Points)
Health Consequences – Total Points: 25
-
Share of Adults with High Cholesterol: Full Weight (~5.56 Points)
-
Share of Diabetic Adults: Full Weight (~5.56 Points)
-
Share of Adults with High Blood Pressure: Full Weight (~5.56 Points)
-
Heart-Disease Rate: Full Weight (~5.56 Points)
-
Obesity-Related Death Rate*: Half Weight (~2.78 Points)
Food & Fitness – Total Points: 15
-
Share of Adults with Low Fruit/Vegetable Consumption: Full Weight (~1.50 Points)
Note: This metric refers to the share of adults who consume fruit and vegetables less than one time per day.
-
Share of Residents Who Say They Eat Healthy: Full Weight (~1.50 Points)
-
Limited Access to Healthy Food: Full Weight (~1.50 Points)
Note: This metric measures the share of urban-area residents who earn a low income and live more than 1 mile from a grocery store or supermarket.
-
Share of Physically Inactive Adults: Full Weight (~1.50 Points)
-
City Friendliness toward an Active Lifestyle: Quadruple Weight (~6.00 Points)
Note: This metric is based on data from WalletHub’s “Best & Worst Cities for an Active Lifestyle” ranking.
-
Access to Parks & Recreational Facilities: Full Weight (~1.50 Points)
Note: This metric measures the share of individuals who live reasonably close to a location for physical activity – parks or recreational facilities.
-
Number of Health Educators and Community Health Workers per Capita: Full Weight (~1.50 Points)
Note: Health educators teach people about behaviors that promote wellness. They develop and implement strategies to improve the health of individuals and communities.


Leave feedback about this